When teams evaluate AI SRE tools, the conversation usually starts with features. Who has the best RCA? Who integrates with Slack? Who supports Kubernetes?
The more useful question is: what does this tool assume about your observability stack?
That assumption shapes everything downstream: deployment complexity, ongoing cost, accuracy ceiling, and how much of your existing infrastructure you keep versus replace. Three distinct philosophies have emerged in the market, and understanding them saves months of evaluation time.
Approach 1: Work With What You Have
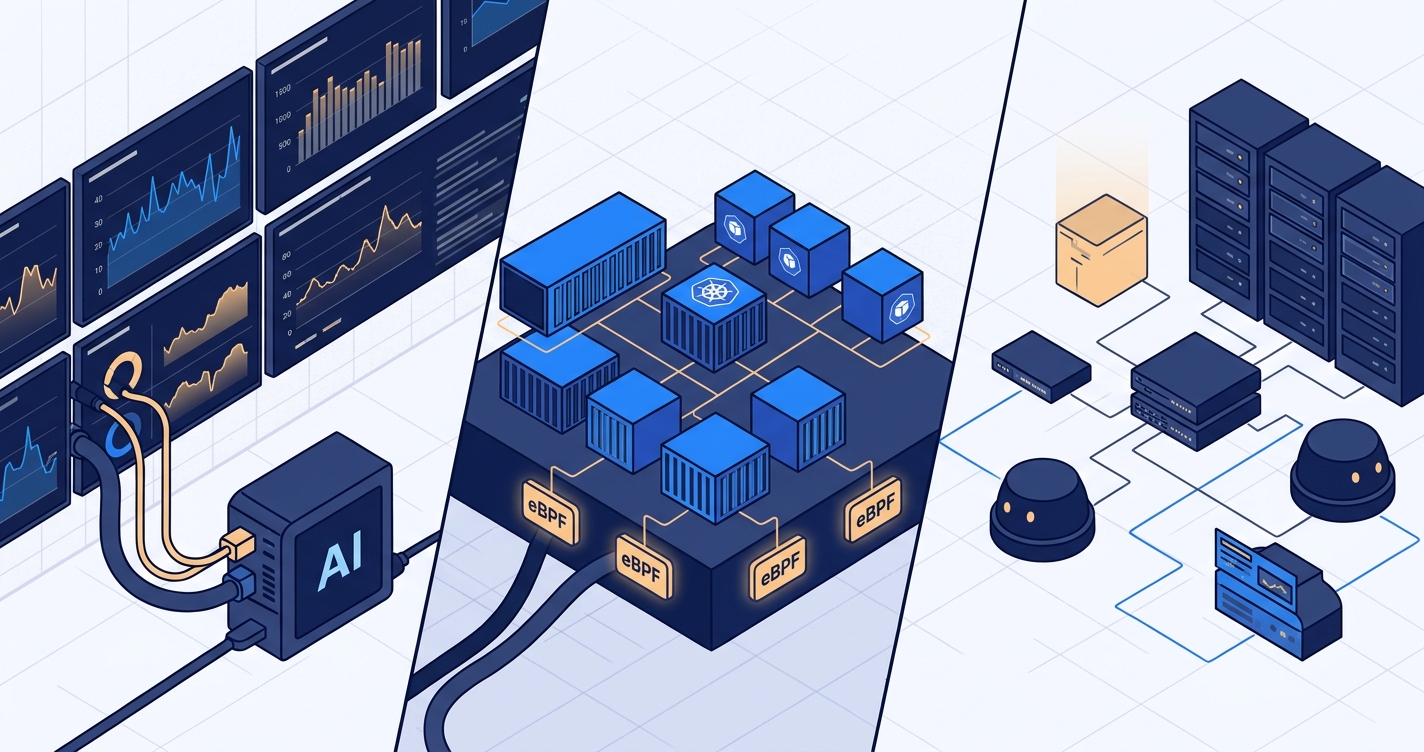
Philosophy: Your organization already runs monitoring. You have Datadog, or Grafana, or CloudWatch, or New Relic, or some combination. You have alerts configured. You have dashboards. You have years of institutional knowledge baked into those systems. An AI SRE should plug into that existing telemetry, not replace it.
How it works: The AI connects to your current observability tools through their APIs. When an alert fires, it pulls metrics, logs, and traces from the systems you already trust. It builds a knowledge graph of your infrastructure from the data those systems already collect: service dependencies, deployment history, past incidents, communication patterns.
The key engineering challenge is not data collection. It is retrieval: knowing which 2% of your existing data matters for this specific investigation, right now. That requires a structured model of your system, not just access to raw APIs.
What this gets right:
- Zero additional telemetry cost. You are not paying to collect data twice.
- Deployment is fast. No agents to install, no kernel modules, no instrumentation changes.
- Works across any cloud, any orchestrator, any monitoring stack. The AI adapts to your setup, not the other way around.
- Preserves your team''s existing workflows. The dashboards and alerts they trust continue to work. The AI adds investigation capability on top.
Where it gets hard:
- Accuracy depends on the quality of your existing telemetry. If your monitoring has blind spots, the AI inherits those blind spots.
- Different observability tools expose data differently. Building reliable integrations across Datadog, Grafana, CloudWatch, and a dozen others is real engineering work.
- The knowledge graph and agentic retrieval layer that makes this approach accurate at scale is non-trivial to build. Without it, you are just feeding raw API responses to an LLM and hoping for the best.
Best fit for: Organizations with mature observability stacks that work well enough. Teams that do not want to rip and replace their monitoring. Environments with mixed infrastructure (Kubernetes, ECS, EC2, VMs) where a single-orchestrator solution will not cover everything.
Approach 2: Collect Your Own Telemetry
Philosophy: Reliable RCA depends on having complete, high-fidelity signals. Existing observability platforms emit whatever they were configured to emit, which is often incomplete, inconsistent, or too coarse for root cause analysis. The AI should collect its own telemetry at the kernel level using eBPF, ensuring it always has the data it needs.
How it works: An eBPF-based agent is deployed into your Kubernetes clusters. It hooks into Linux kernel events to capture network traffic, system calls, and process behavior without requiring code changes or container restarts. The AI then has first-party access to high-resolution data: every HTTP request between services, every DNS lookup, every TCP connection, captured at the kernel level rather than the application level.
This gives the AI a complete picture of what actually happened, not what your monitoring tool was configured to report.
What this gets right:
- Signal completeness. The AI is never limited by gaps in your existing monitoring configuration. If a service interaction happened, eBPF saw it.
- Consistency. Every service is instrumented the same way, regardless of language, framework, or team practices. No more "this service has great traces but that service has nothing."
- Deep visibility. Kernel-level data captures things that application-level instrumentation misses: network retransmissions, DNS resolution delays, container resource contention.
Where it gets hard:
- Kubernetes only (typically). eBPF requires a Linux kernel, so this approach is strongest in containerized environments. If your infrastructure spans VMs, ECS, bare metal, or Windows, coverage gets uneven.
- You are adding another data collection layer. Even if the AI SRE vendor handles the storage, there is overhead: CPU and memory on every node for the eBPF agent, network bandwidth for exporting telemetry, and the operational complexity of running kernel-level instrumentation in production.
- Overlap with existing tools. If you already pay for Datadog or New Relic, you now have two systems collecting similar data. The eBPF data might be better, but you are unlikely to turn off the existing monitoring, so costs stack.
- Security and compliance teams may have opinions about deploying kernel-level agents in production. eBPF is safe by design (programs are verified before loading, and a crash will not take down the kernel), but the conversation still happens.
Best fit for: Kubernetes-native organizations that want deep, consistent telemetry without relying on per-service instrumentation. Teams frustrated with gaps in their current monitoring. Environments where the AI vendor replacing (not supplementing) the observability layer is acceptable.
Approach 3: Assume No Monitoring
Philosophy: Most AI SRE tools turn 100 alerts into 20 hypotheses. That does not help anyone. Instead of depending on observability data that may be incomplete or expensive, build automation that actively diagnoses problems by running checks against live infrastructure. Reduce dependency on "just in case" logging and dashboarding entirely.
How it works: Background agents run continuously, executing diagnostic checks across infrastructure, applications, and data platforms. Instead of waiting for an alert and then querying metrics, the agents proactively probe the system: checking health endpoints, verifying configurations, testing connectivity, validating resource states. When something is wrong, the agent already has the diagnostic data because it collected it as part of the investigation, not because a monitoring system happened to be watching.
The promise extends further: if agents can diagnose problems by running checks on demand, you do not need to store months of high-cardinality metrics "just in case." Observability spend goes down because automation replaces passive dashboarding.
What this gets right:
- No dependency on existing monitoring quality. The AI brings its own diagnostic capability.
- Potentially lower total cost of ownership if the approach genuinely reduces the need for expensive observability platforms.
- Works in environments with minimal monitoring, which is more common than the industry likes to admit.
- The "automate diagnostics instead of building dashboards" framing resonates with teams drowning in dashboard sprawl.
Where it gets hard:
- Proactive diagnostics have limits. You can check "is this endpoint healthy?" but you cannot reconstruct a cascading failure across 50 microservices from health checks alone. Time series data, distributed traces, and correlated logs exist for a reason.
- Reducing observability spend sounds great until the first incident that needed historical metrics you no longer retain. The promise of "you will not need that data" is hard to validate until you need it and do not have it.
- Running continuous diagnostic agents against production infrastructure is its own operational burden. Those agents need permissions, network access, error handling, and monitoring of their own.
- The approach works best for known failure modes (things you can write a check for). Novel failures, the ones that actually cause extended outages, are by definition the ones nobody thought to check for.
Best fit for: Organizations with minimal existing monitoring that want to leapfrog the "build out a full observability stack first" step. Teams with high observability costs looking to reduce spend. Environments where the primary pain is not "we cannot find the root cause" but "we do not have the automation to act on what we know."
The Tradeoffs, Side by Side
| Work With Existing | Collect Own (eBPF) | Assume No Monitoring |
|---|
| Telemetry cost | None (uses existing) | Additional (eBPF agents) | Claims to reduce overall |
| Deployment speed | Fast (API integration) | Medium (agent rollout) | Medium (agent rollout) |
| Infrastructure scope | Any (K8s, ECS, VMs, multi-cloud) | Primarily Kubernetes | Broad but check-based |
| Signal depth | Depends on existing tools | Kernel-level, very deep | Diagnostic, on-demand |
| Accuracy ceiling | Limited by existing telemetry quality | High if eBPF covers the environment | Limited for novel failures |
| Existing stack | Preserved | Partially replaced | Potentially reduced |
| Biggest risk | Blind spots in current monitoring | Operational overhead of kernel agents | Missing data during novel incidents |
What This Means for Your Evaluation
There is no universally correct approach. The right choice depends on where you are:
If you have a mature observability stack and the problem is "we have the data but cannot investigate fast enough," start with Approach 1. You do not need to collect more data. You need something that can reason over what you already have.
If your monitoring is inconsistent across services and the problem is "we do not trust our telemetry," Approach 2 solves that by giving you uniform, high-fidelity data. Be prepared for the operational overhead of another agent in your cluster.
If you are early in your monitoring journey or your observability costs are unsustainable, Approach 3 offers a different path. Be honest about the risks: novel incidents still need historical data, and no amount of proactive checking replaces a good distributed trace when things go sideways.
The worst outcome is choosing an approach that fights your existing infrastructure instead of complementing it. An AI SRE that requires you to rip out your monitoring to work is not saving you time. One that ignores your monitoring entirely is leaving data on the table. The best tools meet you where you are.
At Sherlocks.ai, we took Approach 1 because we believe most organizations already have the signals they need. They just cannot reason over them fast enough when it matters. The knowledge graph, the agentic retrieval, the statistical pre-processing: all of it exists to extract maximum value from the telemetry you already collect. No additional agents, no kernel modules, no replacement of tools your team already trusts.