Introduction
Learn about Sherlocks AI and how it transforms SRE operations
What is Sherlocks AI?
Sherlocks AI is an AI-powered SRE platform that acts as an autonomous reliability engineer for your team. It continuously monitors your infrastructure, applications, and services to detect issues, perform root cause analysis, and provide actionable insights—all in real-time through Slack.
Think of Sherlocks as having expert SREs who work 24/7/365, never sleep, and have perfect memory of every incident, deployment, and system behavior across your entire stack.
Why Sherlocks AI Exists
The Problem:
- Modern systems are too complex for manual monitoring
- Mean Time To Resolution (MTTR) is increasing as systems grow
- SRE teams spend 60-80% of time on toil and firefighting
- Incident context is scattered across multiple tools and platforms
- Knowledge is siloed in individual team members' heads
- Post-mortems are written but rarely referenced
The Solution:
Sherlocks consolidate all your telemetry, learn from every incident, and provide instant, context-aware analysis when things go wrong. They don't replace your SRE team—they amplify your team.
High-Level Value Proposition
Reduce MTTR by 70%
Get instant root cause analysis instead of hours of investigation
Improve Customer Satisfaction (CSAT)
Reduce time to resolve Engineering Support tickets by reducing back and forth between engineering and getting to the RCA faster
Institutional Memory
Never lose incident knowledge when team members leave
Slack-Native
Work where your team already collaborates
Architecture Summary
Sherlocks AI offers flexible deployment models to meet your security and compliance requirements:
Fully managed cloud service with Watson agent deployed in your VPC for secure data access
Deploy the entire Sherlocks AI platform in your own infrastructure
Mix and match components based on your security requirements
Core Concepts
Understanding the building blocks of Sherlocks
Supported Integrations
Sherlocks integrate with your existing tools and infrastructure
Cloud Providers
AWS
EC2, RDS, Lambda, S3, CloudWatch, ECS
Google Cloud Platform
Compute Engine, Cloud SQL, GKE, Cloud Monitoring
Microsoft Azure
VMs, Azure SQL, AKS, Azure Monitor
Kubernetes
Kubernetes
Pods, Deployments, Services, Events, Logs, Resource Metrics
Helm
Release tracking and version management
Datastores
MySQL
Query performance, replication status, deadlocks
PostgreSQL
Query stats, connection pools, replication lag
MongoDB
Operations, index stats, replication state
Redis
Memory usage, client connections, keyspace stats
Cassandra
Node health, compaction metrics, latency
Message Queues
Apache Kafka
Consumer lag, partition health, broker metrics
RabbitMQ
Queue metrics, bindings, node health
Amazon SQS
Queue depth, message age, DLQ stats
Azure Service Bus
Message throughput, DLQ monitoring
CI/CD & Version Control
GitHub Actions
Workflow runs, failures, deployment tracking
Jenkins
Build history, job failures, pipeline correlation
Azure Pipelines
Pipeline runs, logs, artifacts
GitHub
Commits, PRs, branches, deployment events
Observability & APM
Prometheus
Metrics, time-series, alert rules
Datadog
Infrastructure metrics, APM traces, logs, dashboards
New Relic
APM, error tracking, transaction metrics
Sentry
Error events, performance traces
Coralogix
Log aggregation, queries, correlations
Logging
Elasticsearch (ELK)
Log search, aggregations, cluster health
Coralogix
Centralized logging and analysis
Loki
Log aggregation, queries, alerts
Collaboration
Slack
Incident channels, thread analysis, bot interactions
Microsoft Teams
Coming soon
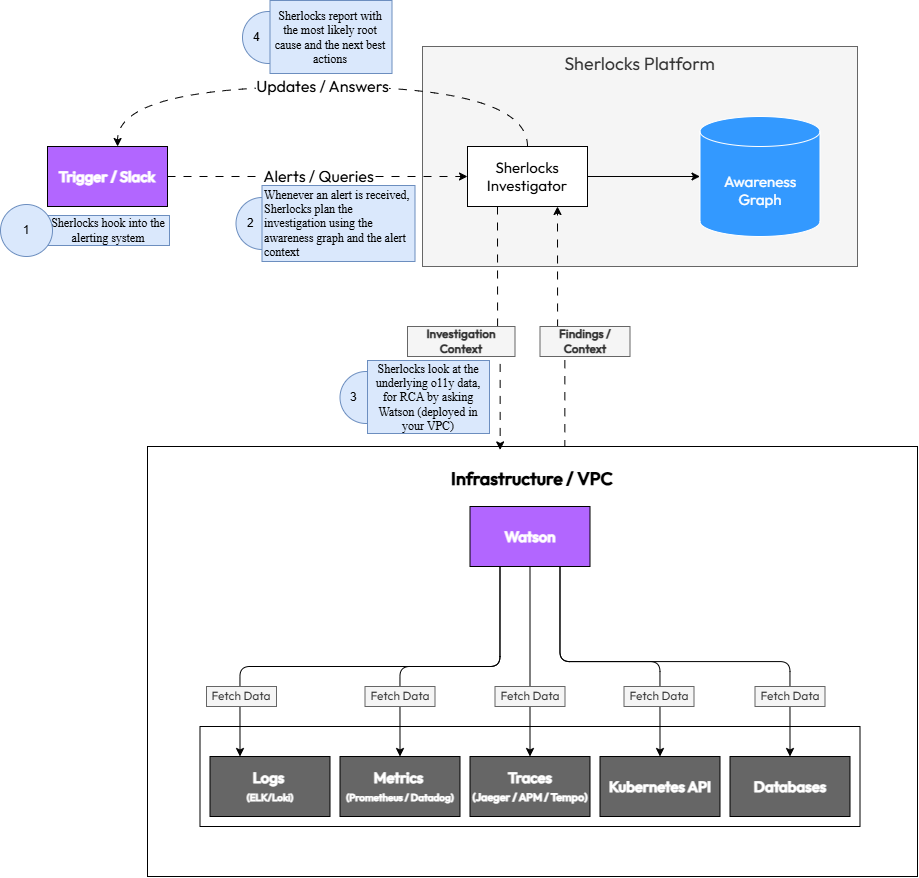
How Sherlocks AI Works
Understanding the end-to-end flow from data ingestion to incident resolution
1Slack Ingestion
Sherlocks monitor your Slack workspace for incident-related conversations, questions, and alerts. They learn from team discussions, incident channels, and post-mortems to build contextual understanding.
2Telemetry Access for RCA via Watson
During an RCA, the Watson agent accesses telemetry from your infrastructure as needed to provide context and insights:
- Metrics from Prometheus, Datadog, CloudWatch
- Logs from ELK, Coralogix, or cloud logging
- Traces from APM tools
- Infrastructure state from Kubernetes, cloud APIs
- Database and queue health metrics
- CI/CD pipeline events
3Awareness Graph Building
Sherlocks construct a living map of your system by correlating:
- Service dependencies and communication patterns
- Normal vs. abnormal behavior baselines
- Historical incident patterns
- Deployment and code change timelines
- Team knowledge from Slack conversations
This graph continuously evolves as your system changes and new incidents occur.
4AI Reasoning Engine
When an investigation is triggered (manually, by alert, or proactively), Sherlocks:
- Identify relevant signals from the Awareness Graph
- Correlate metrics, logs, and traces across time and services
- Generate hypotheses about potential root causes
- Test hypotheses against available data
- Rank causes by likelihood and impact
- Consider historical similar incidents
The LLM reasoning happens in your chosen environment (cloud or self-hosted).
5RCA Generator
Sherlocks generate a comprehensive Root Cause Analysis including:
- Primary root cause with confidence level
- Contributing factors
- Timeline of events leading to the issue
- Affected services and blast radius
- Recommended remediation steps
- Links to relevant logs, metrics, and commits
6Slack Response
Sherlocks deliver findings directly in Slack with:
- Clear, actionable summary
- Interactive elements for deeper investigation
- Links to dashboards and relevant resources
- Suggested next steps
- Option to ask follow-up questions
Example Response:
"The API slowdown started at 14:23 UTC, 2 minutes after deployment v2.3.4. Root cause: N+1 query in UserService.getProfile() introduced in commit abc123. This is causing 50x more database queries. Recommend: rollback to v2.3.3 or apply hotfix to add eager loading."
Deployment Models
Flexible deployment options to meet your security and compliance requirements
SaaS ModelRecommended for most teams
The Sherlocks AI platform runs in our cloud, while the Watson agent runs inside your VPC/infrastructure.
Architecture:
- Watson agent deployed via Helm in your Kubernetes cluster
- Agent has read-only access to your infrastructure
- Telemetry metadata sent to Sherlocks AI cloud (encrypted in transit)
- AI reasoning happens in Sherlocks AI cloud
- Results delivered via Slack
Cloud-Native SaaSQuickest to get started
The entire Sherlocks AI platform, including Investigators and the Watson Data Agent, is deployed and managed within Sherlocks AI's secure cloud infrastructure. This model connects directly to your cloud accounts and other monitoring sources, eliminating the need for any agent installation or additional infrastructure on your end.
Architecture:
- Sherlocks Investigators and Watson Data Agent deployed in Sherlocks AI cloud
- Connects directly to your cloud accounts via secure API authentication
- No agents, Kubernetes pods, or VMs required in your infrastructure
- All monitoring sources integrated directly from Sherlocks AI cloud
- Managed updates and scaling by Sherlocks AI
Fully In-VPC SherlocksMaximum control
Deploy the entire Sherlocks AI platform within your own infrastructure with no external dependencies.
Architecture:
- Complete Sherlocks stack runs in your VPC
- No data leaves your environment
- Self-managed updates and scaling
- Requires self-hosted LLM or private cloud LLM
In-VPC LLM (Azure OpenAI)Enterprise AI security
Use Azure OpenAI Service within your own Azure tenant for enterprise-grade AI with data residency guarantees.
Benefits:
- LLM runs in your Azure subscription
- Microsoft's enterprise data protection guarantees
- No training on your data
- Compliance with SOC 2, HIPAA, GDPR
- Data residency in your chosen Azure region
Installation & Integration Steps
Step-by-step guide to get Sherlocks running in your environment. The installation steps are covered in this guide.
Prerequisites
- Kubernetes cluster (v1.20+) with Helm 3 installed
- Admin access to grant IAM roles for cloud providers
- Slack workspace admin access
Example Use Cases
Real-world scenarios where Sherlocks accelerate incident resolution
Slow API Calls
API response time increased from 100ms to 1s
Sherlocks correlate the latency spike with a recent deployment, identify a new N+1 query pattern in the database, and point to the specific commit that introduced it.
MTTR reduced from 2 hours to 5 minutes
Build Failure Leading to Partial Deployment
Some microservices deployed, others failed silently
Sherlocks correlate CI/CD pipeline failures with missing services in Kubernetes, identify the failed build step, and link to the problematic commit.
Complete context provided immediately
Kafka Backlog + Consumer Lag
Message processing falling behind, queue growing
Sherlocks identify that a consumer pod is crash-looping due to OOM, correlate with recent traffic spike, and suggest scaling.
Proactive detection before customer impact
Kubernetes Crash Loop
Pod repeatedly restarting
Sherlocks analyze pod logs, identify a missing environment variable introduced in the latest deployment, and provide the exact fix.
Root cause identified in seconds
Low DB Connections or Replication Lag
Database connection pool exhausted, queries timing out
Sherlocks detect connection pool saturation, identify a long-running query holding connections, and correlate with a recent code change.
Prevented database outage
Permissions Model
Detailed breakdown of required permissions and security guarantees
Security Guarantee
All permissions are read-only. Sherlocks cannot modify your infrastructure, databases, or application data. We collect only metadata and metrics—never raw application data, PII, or secrets.
| System | Required Permissions | Purpose | Business Value |
|---|---|---|---|
MySQL Database | SELECT on INFORMATION_SCHEMA, SHOW commands for metadata | Monitor query performance, replication status, connection pools, and deadlocks | Identify slow queries and database bottlenecks affecting user experience |
MongoDB Database | Read-only access to admin and local databases, serverStatus command | Track operations, index statistics, replication state, and connection metrics | Detect performance degradation and replication lag before it impacts users |
Redis Database | INFO command, read-only key access for metadata | Monitor memory usage, key counts, replication status, and eviction metrics | Prevent cache misses and memory issues that slow down applications |
Elasticsearch Database | Read-only cluster and index stats API access | Track index health, search performance, and cluster resource usage | Ensure search functionality remains responsive during high traffic |
Cassandra Database | Read-only access to system tables and nodetool metrics | Monitor cluster health, compaction status, and read/write latencies | Maintain database availability and prevent query timeouts |
Kafka Queue | Read-only consumer group and topic metadata access | Track consumer lag, partition health, broker metrics, and throughput | Prevent message backlog that causes delayed processing and user complaints |
RabbitMQ Queue | Read-only access to management API for queue and exchange stats | Monitor queue depths, message rates, and connection health | Detect message processing bottlenecks before they cause system failures |
Amazon SQS Queue | CloudWatch metrics read access, SQS GetQueueAttributes | Track queue depth, message age, and throughput metrics | Identify and resolve message processing delays proactively |
Azure Service Bus (Queues/Topics) Queue | Read-only access to queue/topic metrics and message counts | Monitor active message counts, dead letter queues, and processing rates | Prevent message accumulation that leads to service degradation |
Kubernetes Orchestration | Read-only access to pods, services, deployments, events, and nodes | Map service dependencies, track resource usage, and monitor pod health | Enable rapid incident response by understanding service topology and health |
Clouds (AWS, GCP, Azure) Cloud | Read-only access to CloudWatch/Stackdriver/Monitor metrics and resource metadata | Collect infrastructure metrics, resource utilization, and service health data | Correlate application issues with infrastructure problems for faster root cause analysis |
Prometheus Observability | Read-only query API access to metrics and time-series data | Query metrics for baseline establishment and anomaly detection | Leverage existing metrics infrastructure for comprehensive system visibility |
Datadog Observability | Read-only API access to metrics, events, and dashboards | Query metrics and correlate with application performance data | Unify observability data for faster incident investigation |
New Relic / Sentry (APM & Error Tracking) Observability | Read-only API access to application performance metrics and error traces | Correlate infrastructure issues with application errors and performance degradation | Connect infrastructure problems to user-facing issues for complete incident understanding |
Coralogix / ELK Observability | Read-only access to log aggregation and search APIs | Query logs during incidents to understand system behavior and errors | Speed up root cause analysis by correlating metrics with log events |
GitHub (Code Repository) CI/CD | Read-only access to repository metadata, commit history, and code | Analyze code changes that may have caused incidents and understand service dependencies | Link incidents to code changes for faster resolution and prevention |
Jenkins (CI Server) CI/CD | Read-only access to build history and job metadata | Correlate deployments and builds with incident timelines | Identify if recent deployments caused issues, enabling quick rollback decisions |
GitHub Actions (CI/CD) CI/CD | Read-only access to workflow runs and job metadata | Track deployment history and correlate with incident occurrences | Understand deployment impact on system stability |
Azure Pipelines (Azure DevOps) CI/CD | Read-only access to pipeline runs and release metadata | Monitor deployment frequency and correlate releases with incidents | Enable data-driven deployment decisions and faster incident resolution |
What Sherlocks Does With This Data
- Builds the Awareness Graph mapping service dependencies
- Establishes baselines for normal system behavior
- Correlates signals during incident investigations
- Identifies anomalies and potential issues
- Generates root cause analyses
- Learns from incidents to improve future investigations
Data Exfiltration Protection
Watson agent runs inside your VPC with no ability to access application data from databases or queues. Only aggregated metrics and metadata are transmitted to the Sherlocks AI platform (or kept entirely in your environment with self-hosted deployment).
Data Security & Privacy
How Sherlocks protect your data and maintain security
Isolation Model
Watson agent runs entirely within your VPC or infrastructure, ensuring your data never leaves your control:
- Agent deployed via Helm in your Kubernetes cluster
- Direct access to your infrastructure using your network
- No VPN or external access required
- Telemetry processed locally before transmission
Read-Only IAM Roles
Watson operates with strictly read-only permissions across all integrations:
- Cannot modify infrastructure, databases, or queues
- Cannot execute commands or deploy changes
- Cannot access secrets or credentials
- Permissions follow principle of least privilege
No Raw Data Access
Watson collects metadata and metrics, not application data:
- Database connection counts
- Query execution times
- Replication lag metrics
- Queue depth and message age
- Error rates and types
- Table data or records
- Message contents
- Customer PII
- API keys or secrets
- Source code
TLS & Encryption
- All data in transit encrypted with TLS 1.3
- Data at rest encrypted using AES-256
- Separate encryption keys per customer
- Key rotation policies enforced
Optional Private LLM
For maximum data privacy, use a private LLM deployment:
- Azure OpenAI: LLM runs in your Azure tenant with Microsoft's data protection guarantees
- AWS Bedrock: Fully managed in your AWS account
- Self-Hosted: Run open-source models in your infrastructure
Retention Policy
- Telemetry metadata retained for 90 days by default (configurable)
- Incident analyses retained for 1 year
- Awareness Graph continuously updated, old patterns pruned
- Data deletion requests honored within 30 days
Self-Hosting Options
For complete control, deploy Sherlocks entirely in your infrastructure:
- All components run in your VPC
- No external dependencies
- You control all data retention and deletion
- Suitable for air-gapped environments
Bring Your Own Cloud (BYOC) LLM
Use your own LLM API keys and accounts:
- Sherlocks use your Azure OpenAI or Anthropic account
- LLM costs billed directly to you
- Full visibility into LLM usage and costs
- Compliance with your existing LLM vendor agreements
Custom Instructions
Teach Sherlocks about your team's processes and preferences
Global Instructions
Set team-wide guidelines that apply to all investigations:
Example Global Instructions:
- Always check the #deployments channel for recent changes
- Our peak traffic hours are 9 AM - 5 PM EST
- Database queries over 1s are considered slow
- Escalate to @oncall-sre for production issues
- We prefer rollback over hotfix for critical issues
Per-Service Overrides
Provide service-specific context and thresholds:
Payment Service:
- Normal latency: 50-100ms
- Depends on: wallet-service, stripe-api
- Known issue: Stripe rate limits at 100 req/s
- Owner: @payments-team
User Service:
- Cache hit rate should be \u003e 90%
- Redis failover takes 30s (expected)
- Owner: @backend-team
Assistant Levels
Choose the depth of analysis for different situations:
Quick Triage
Fast, surface-level analysis. Good for initial assessment or low-priority issues.
Detailed Investigation
Comprehensive RCA with correlation across multiple signals. Default mode.
Strategic Analysis
Deep analysis with architectural recommendations and long-term solutions.
Safety Boundaries
Define what Sherlocks should never do:
- Never suggest deleting production data
- Never recommend scaling down during business hours
- Always require approval before suggesting rollbacks
- Don't investigate PII-related logs
Company SRE Cultural Preferences
Encode your team's debugging philosophy:
Example Cultural Instructions:
- "We value blameless post-mortems"
- "Always consider blast radius before suggesting changes"
- "Prefer gradual rollouts over big-bang deploys"
- "Document everything in Confluence"
- "We communicate outages in #customer-updates within 5 minutes"
Escalation Rules
Define when and how to escalate:
- Page @oncall-sre for SEV-1 incidents (customer-facing outage)
- Notify @backend-lead for database issues
- Alert @security-team for authentication failures \u003e 10/min
- Create Jira ticket for non-urgent issues
Example Templates
"How we debug production issues"
2. Review error rates in Datadog
3. Examine logs for stack traces
4. Check database connection pools
5. Verify external API health
6. Consider rollback if deployed \u003c 1 hour ago
"How we talk to customers on outages"
- Provide ETAs only if confident
- Update every 30 minutes
- Never blame third parties publicly
"Our rollback policies"
- Rollback within 15 min for SEV-2
- Hotfix acceptable for SEV-3+
- Always notify #engineering before rollback
Sherlocks in Slack
How to interact with Sherlocks through Slack
Query Formats
Ask Sherlocks questions using natural language:
@sherlocks why is the API slow?
General investigation request
@sherlocks what caused the deployment failure?
Specific incident investigation
@sherlocks show me the health of the payment service
Service health check
@sherlocks what changed in the last hour?
Change tracking
@sherlocks explain this error: [paste stack trace]
Error analysis
Slack Shortcuts
Use Slack shortcuts for quick actions:
- /investigate - Start a new investigation
- /sherlock-status - Check system health
- /sherlock-recent - View recent incidents
- /sherlock-help - Get help and examples
Screen Share & Voice Debugging
During Slack huddles or calls, Sherlocks can participate in real-time debugging sessions:
- Share your screen showing dashboards or logs
- Ask Sherlocks questions verbally
- Sherlocks respond in the thread with analysis
- Collaborative investigation with your team
Incident Channel Automation
When you create an incident channel (e.g., #incident-2024-01-15), Sherlocks automatically:
- Join the channel
- Begin investigating based on channel name or initial messages
- Post preliminary findings within minutes
- Monitor the conversation for context
- Update analysis as new information emerges
- Generate RCA summary at incident resolution
Auto-Generated RCA Summaries
At the end of an incident, Sherlocks automatically generate a comprehensive RCA including:
- Timeline of events
- Root cause with supporting evidence
- Services and users impacted
- Remediation steps taken
- Recommendations to prevent recurrence
- Links to relevant metrics, logs, and commits
This RCA is posted in the incident channel and stored in the Awareness Graph for future reference.
Interactive Elements
Sherlocks responses include interactive buttons and menus:
- Dig Deeper: Request more detailed analysis
- Show Logs: View relevant log entries
- View Metrics: Open related dashboards
- Similar Incidents: See past similar issues
- Mark Resolved: Close the investigation
- Escalate: Page on-call engineer
Troubleshooting
Common issues and how to resolve them
Agent not visible in Slack
- Sherlocks AI app not installed in workspace
- App not invited to channel
- Permissions not granted
- Reinstall Sherlocks AI app from Slack App Directory
- Invite @sherlocks to the channel with /invite @sherlocks
- Check workspace admin approved the app
Missing permissions errors
- IAM roles not configured correctly
- Credentials expired
- Insufficient permissions granted
- Review permissions table and ensure all required permissions are granted
- Rotate credentials if expired
- Check Watson logs for specific permission errors
- Use sherlock-status command to see integration health
Telemetry not flowing
- Watson agent not running
- Network connectivity issues
- Integration credentials incorrect
- Check Watson pod status: kubectl get pods -n sherlocks
- View Watson logs: kubectl logs -n sherlocks -l app=watson
- Verify network policies allow outbound connections
- Test integration credentials manually
Slack not responding
- Sherlocks AI platform outage
- Rate limiting
- Investigation queue backlog
- Check status.sherlocks.ai for platform status
- Wait a few minutes and retry
- Use /sherlock-status to check queue depth
- Contact support if issue persists
Stuck investigations
- LLM provider timeout
- Insufficient data to analyze
- Complex query requiring more time
- Wait up to 5 minutes for complex investigations
- Rephrase query to be more specific
- Check LLM provider status
- Cancel and restart investigation
LLM timeouts or restrictions
- LLM API rate limits hit
- LLM provider outage
- Content filtering triggered
- Configure fallback LLM provider
- Increase rate limits with your LLM provider
- Review content filtering policies
- Switch to self-hosted LLM
Getting Help
If you're still experiencing issues:
- Email: support@sherlocks.ai
- Slack: Join our community Slack workspace
- Documentation: docs.sherlocks.ai
- Status Page: status.sherlocks.ai
Include Watson logs and investigation IDs when contacting support for faster resolution.
Frequently Asked Questions
Common questions about Sherlocks capabilities and deployment
Glossary
Key terms and concepts in the Sherlocks AI platform
A living knowledge base that maps your entire system's architecture, dependencies, behavior patterns, and incident history. It continuously evolves as your system changes.
The AI reasoning engine that analyzes telemetry, correlates signals, and generates root cause analyses.
The data collection agent that runs in your infrastructure with read-only access to gather telemetry and metadata.
Data points used in investigations: metrics, logs, traces, events, and Slack conversations.
A comprehensive analysis identifying the primary cause of an incident, contributing factors, timeline, and recommended remediation.
A potential explanation for an incident that Sherlocks generates and tests against available data.
The process of analyzing historical data to understand what happened during an incident.
Sherlocks' record of past incidents, their causes, and resolutions, used to identify patterns and accelerate future investigations.
Predefined investigation patterns and remediation steps for common incident types.
The scope of services and users affected by an incident.
The average time it takes to resolve an incident from detection to fix.
Repetitive, manual operational work that doesn't provide lasting value (e.g., manually correlating logs during incidents).
Team-specific guidance you provide to Sherlocks about how to investigate issues, communicate findings, and prioritize concerns.
Different modes of Sherlocks operation: Intern (basic analysis), Senior (detailed investigation), Architect (strategic recommendations).